
How many Amazon distribution workers are in each state?
More analysis using that OSHA data
The animating question’s in the title. It matters because any serious campaign on Amazon will need to prioritize where it allocates its funds, and the question of where workers are concentrated is one key factor in determining this prioritization.
To figure this out, I took OSHA’s 2024 Injury Tracking Application data, just released last month, and matched the average number of employees count by facility address to my existing data with facility codes and types (i.e., the data that I used to generate the updated Amazon Distribution Network map). I then tallied both facility counts per state and total worker counts per state and per facility type.
In the map I separated facilities by type rather than listed co-located facilities together, so I had to go through and delete duplicates in my list to make sure I wasn’t doubling up worker counts. I also had to guess in many cases where OSHA data wasn’t available, and I did so simply by listing the average number of employees per facility type for any facility where the count wasn’t in the OSHA data. I determined the 2024 average number of employees per facility according to same methodology described for the 2023 count here. Here are the 2024 average number of employee numbers:

And here finally are the results: you can see the full spreadsheet here.
The analysis produced a total of 913,546 workers in Amazon’s distribution network, which strikes me as in the ballpark. Amazon claims to have 1.556 million workers on its 10-K, and somewhere around 1.1 million of them work in the US. That would leave around 187,000 workers at corporate, AWS, anything outside of the facilities listed above. That balance seems about right to me.
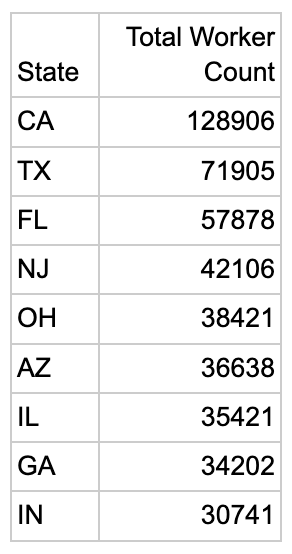
There are only ten states with over 30,000 workers, and they’re listed above. Here’s a visual representation of the distribution:

You’re probably not going to be surprised to learn that it looks a lot like the overall population count per state:

If we look closer at California and only focus in on the LA/Inland Empire region, i.e., just the facilities depicted here:

…then we get 68,960 distribution workers, including:
15,311 IXD workers (13.6% of all IXD workers in the country)
23,340 Sortable FC workers
9,018 Non-Sort FC workers
2,507 SSD workers
4,855 Sortation Center workers, and
9,479 Delivery Station workers (not including Amazon’s DSP or Flex drivers).
Everyone doing logistics organizing already knows about the importance of this region, but it’s helpful to have some numbers.
One last thing: you’ll notice at the bottom of the spreadsheet that by far the biggest employment cluster in the Amazon network is the Sortable FC, with 391,569 workers (42.9% of all Amazon distribution workers). This is also the node that is most subject to Amazon automation efforts.
Great info from you once again! Any way to estimate number of drivers as well? In spite of Amazon’s fiction that they aren’t Amazon employees, they are an important part of the workforce.